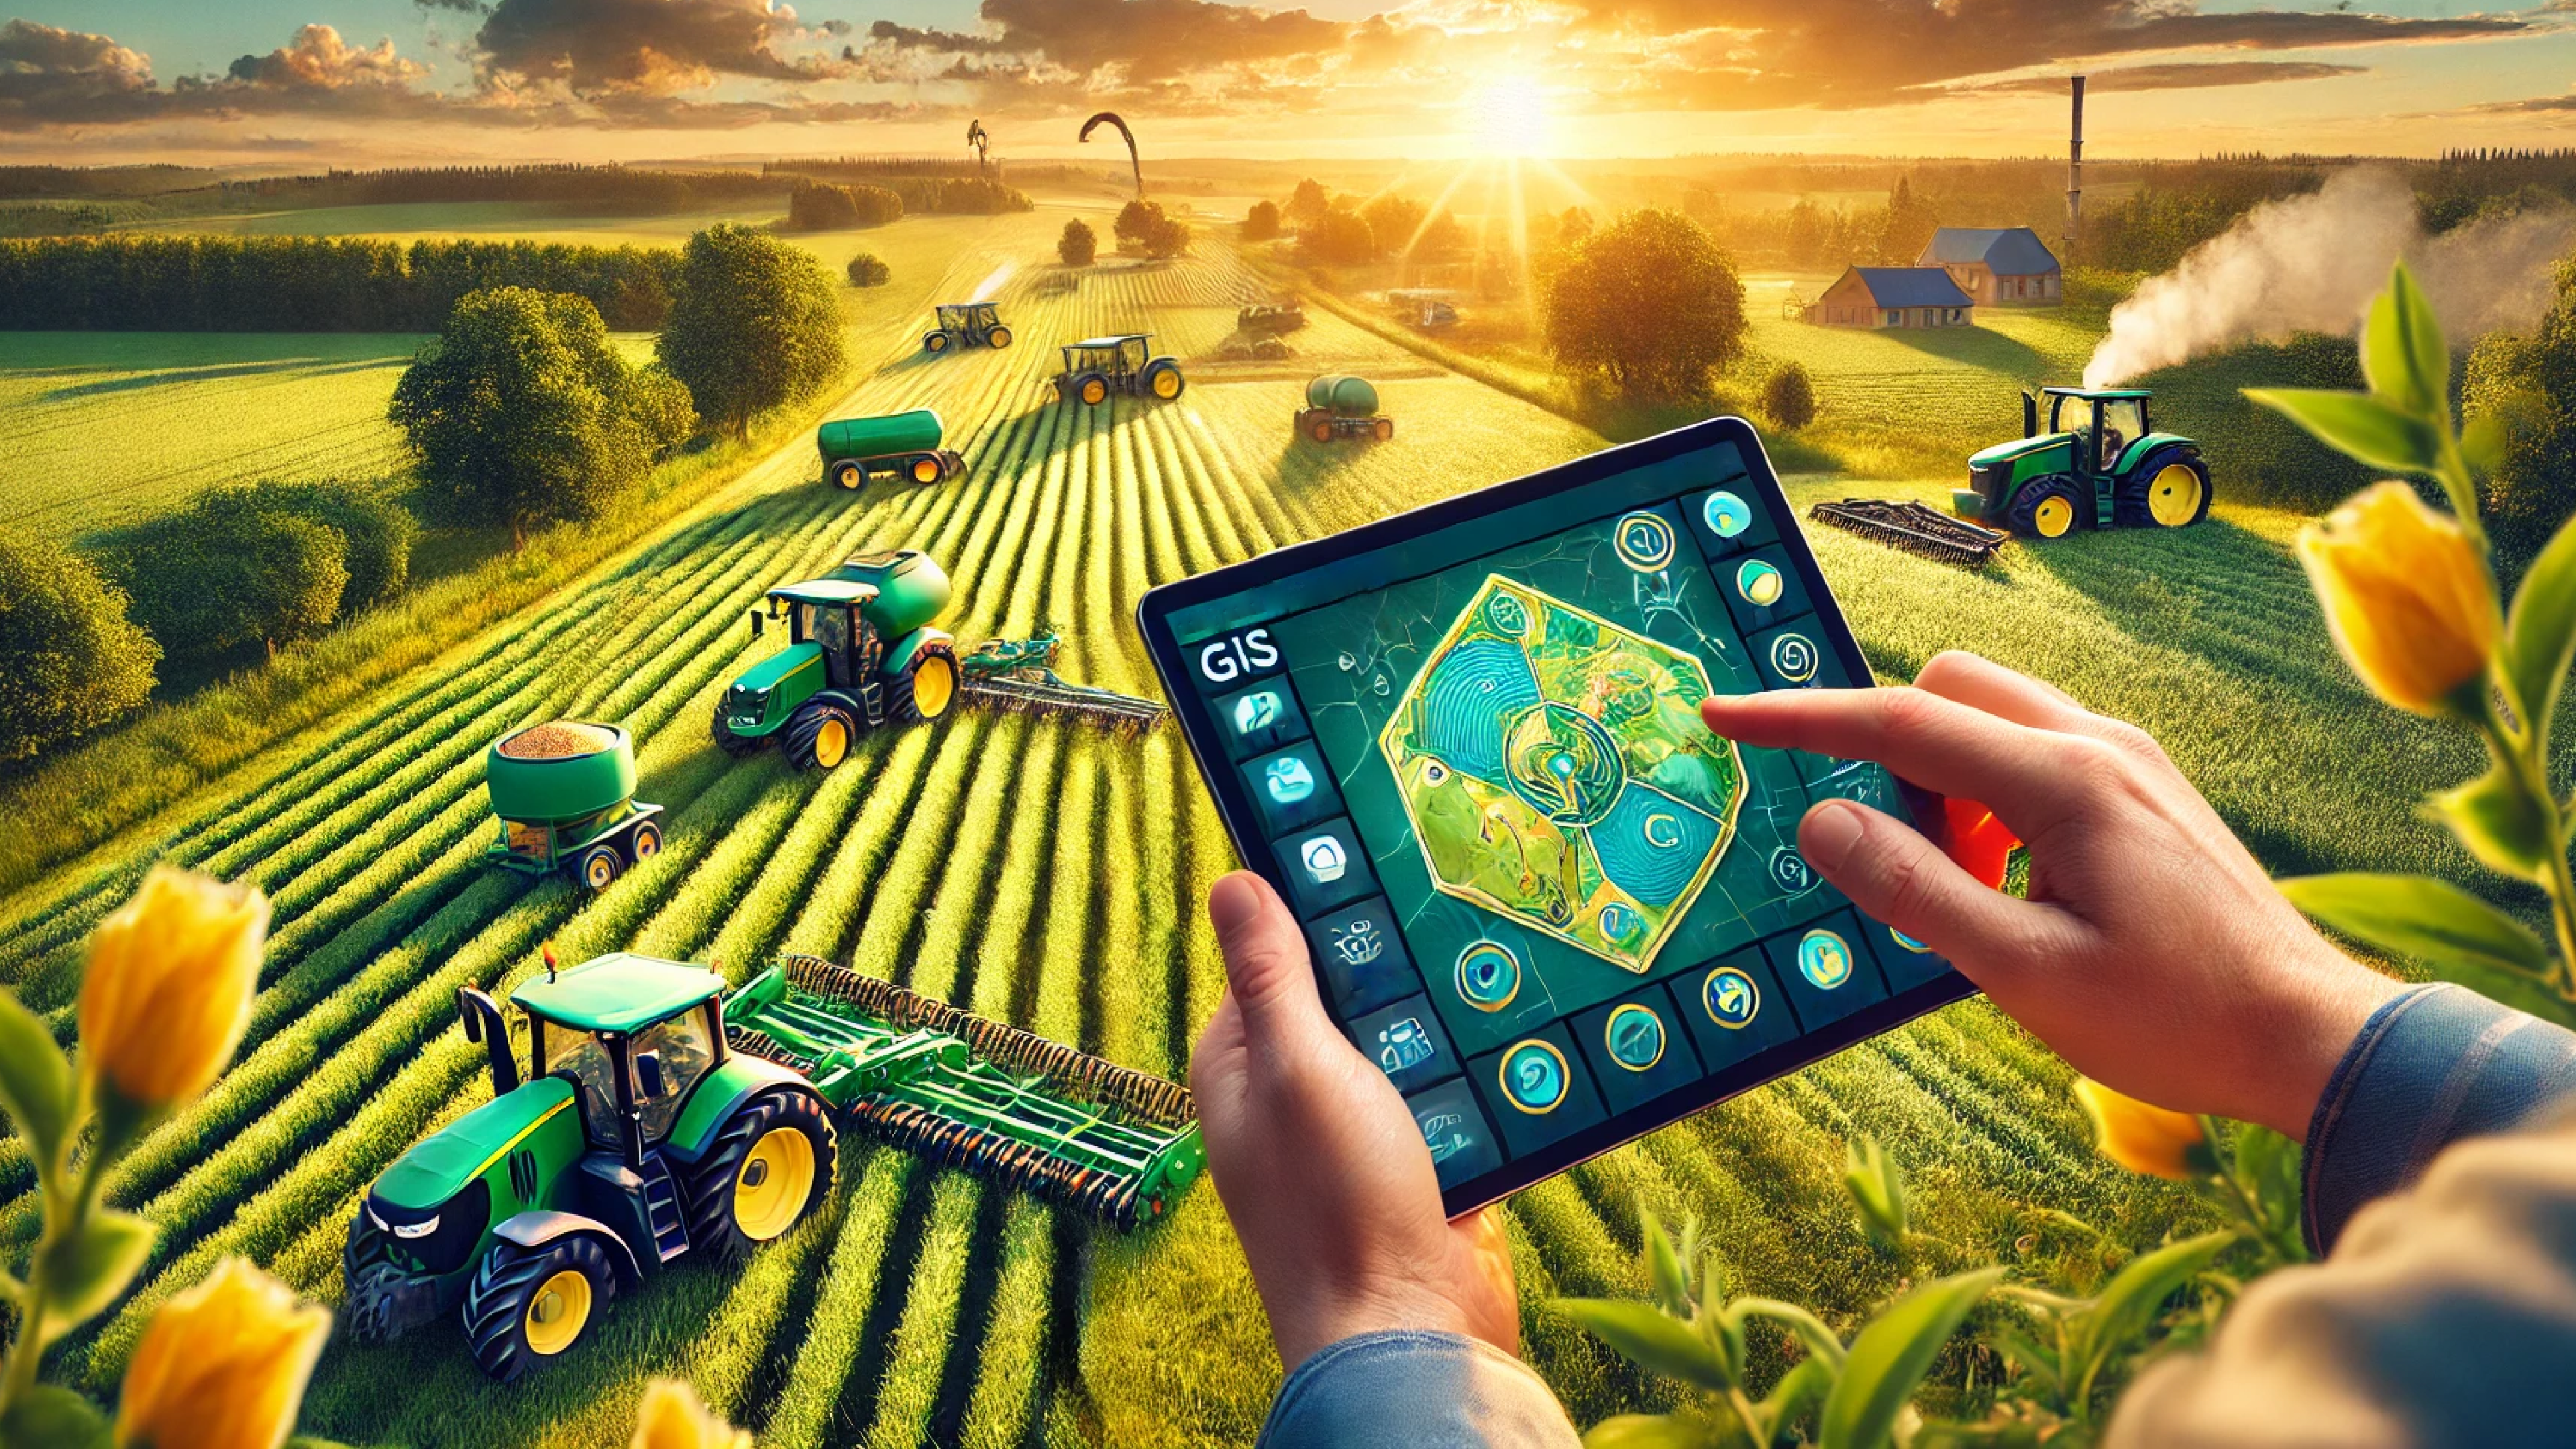
GIS technologies are a modern tool for effective agricultural management. Their application allows an enterprise to receive important information with minimal delay or even in real-time. They help to better plan activities, achieving higher yields at lower costs. GIS technologies increase the level of enterprise competitiveness and help it achieve strategic long-term goals faster. We explain what they are, what advantages they have, and how they are specifically applied in agriculture.
What are GIS Technologies
GIS technologies are a complex of digital methods that allow analyzing the physical characteristics of the planet’s surface. In agriculture, they are used to assess the condition of fields and livestock lands for the most rational use of land resources. For better perception, the data obtained with their help is visualized. Based on this information, multi-layered maps, atlases, graphs, diagrams, and interactive applications are built.
The abbreviation GIS stands for “geographic information systems”. Today, they are mainly created thanks to scientific instruments installed on space satellites. Auxiliary tools include aviation platforms, drones, and ground sensors that allow data to be refined or updated in real-time, minimizing delay. Analysis is carried out using software that can be installed both on a specific gadget and in the cloud. The interface for accessing them is served by various electronic devices – stationary computers, laptops, tablets, smartphones, or specialized devices.
Advantages of GIS Technologies for Agriculture
- Increased yields. According to World Bank statistics, precision farming based on GIS technologies has increased average farm yields by 22%, while reducing freshwater consumption by 20%. This not only increases the profitability of individual enterprises but also helps address the global food crisis.
- Reduced need for manual labor. According to World Economic Forum data, equipment automation using GIS solutions allows one farm worker to operate four machines simultaneously. In the USA, Canada, and the United Kingdom, this reduces costs by $15–20 per month per acre. Additionally, people can free up time for more creative work that contributes to societal development.
- Savings on fertilizers and plant protection products. Geographic information systems enable the creation of variable rate application (VRA) maps, determining optimal material usage for each area. According to WEF research, this has helped Canadian farms reduce fertilizer and pesticide application by 30% while maintaining the same yield levels. Reducing the use of aggressive substances also minimizes environmental risks.
- Optimization of related costs. McKinsey experts have calculated that GIS application reduces costs for fuel procurement, equipment maintenance, and material storage by 7–9%. If the current pace of geographic information technology development continues until 2030, this will increase global GDP by $500 billion. The overall effect of resource savings could reach $2–3 trillion.
- Effective livestock management. GIS enables monitoring of large herds of farm animals. It helps track outbreaks of serious diseases, select productive pastures, and protect herds from predators. According to McKinsey estimates, by 2030 this will bring enterprises up to $20 billion in additional profit.
Read also: Technology of milk and dairy products production in Ukraine
GIS Data Collection and Processing
The main research tool in Ukrainian agriculture is the Landsat-8 artificial satellite. This spacecraft is equipped with a spectrometer and an infrared sensor. They cover the entire spectrum of visible light, as well as near and mid-infrared ranges. The resolution of the instruments ranges from 15 to 100 meters. Modern GIS software allows reducing the error to tens of centimeters.
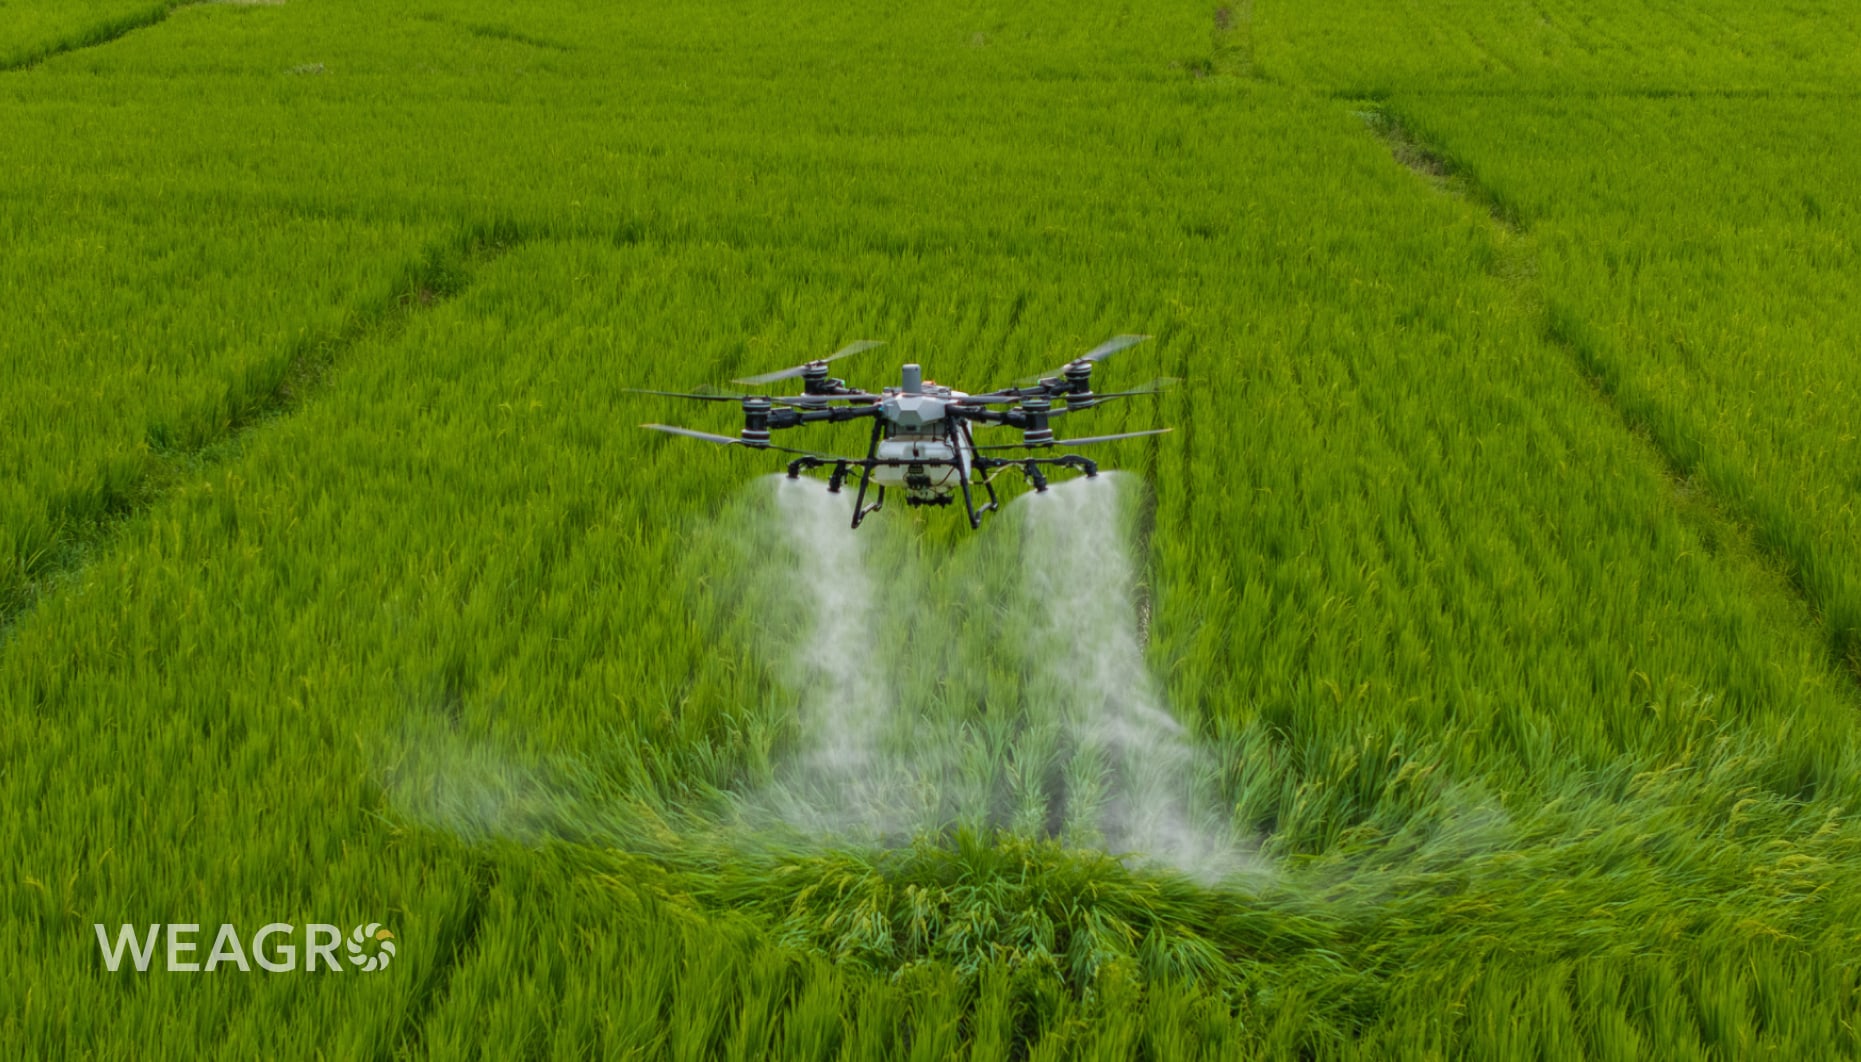
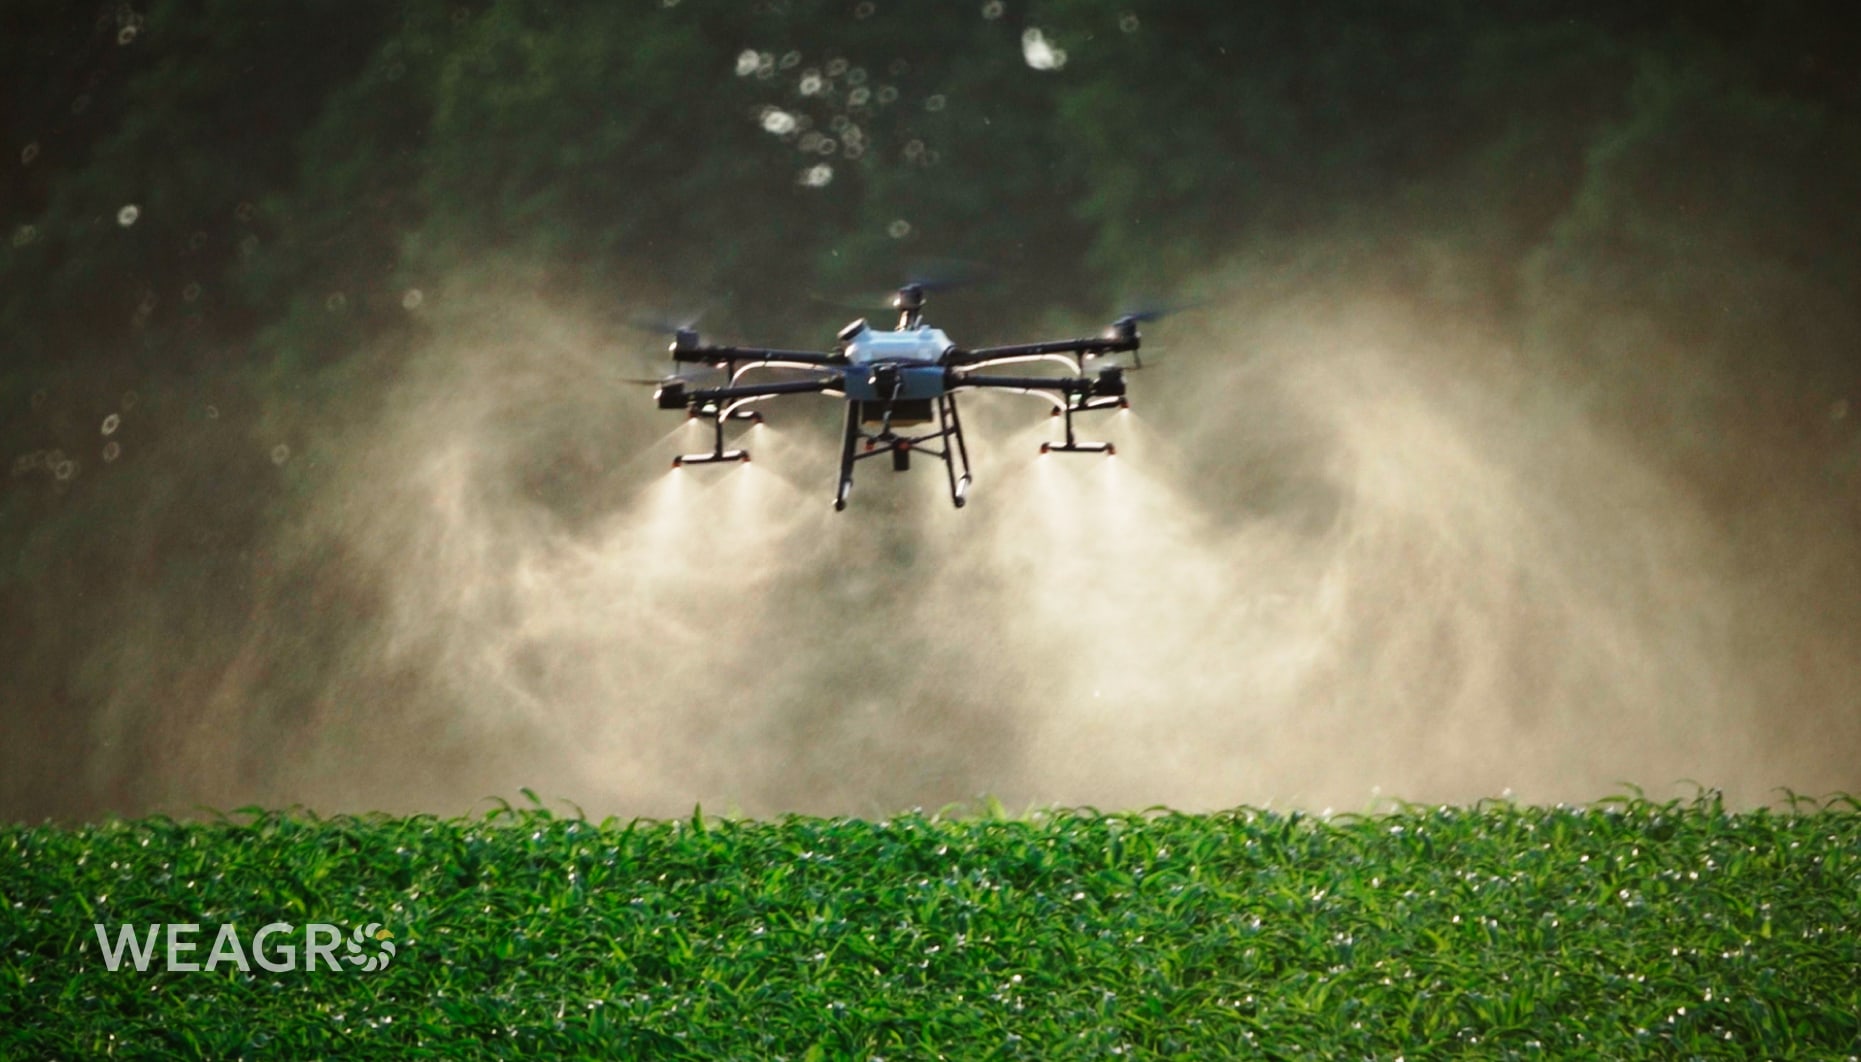
In addition, the geographic information system can use equipment installed on airplanes and drones. However, during martial law, their use is seriously limited. Another element of equipment is ground installations. These can be sensors that indicate coordinates and sensors of physical characteristics – humidity, temperature, insolation, etc.
GIS and databases are mostly located in the “cloud”. This is a decentralized storage that uses many distributed servers. Various tools are used for data processing – from traditional correlation-regression analysis to artificial intelligence. The latter deserves more attention. Big Data and machine learning technologies allow geographic information systems to check all possible relationships and highlight the most stable ones. Thanks to this, it is possible to accurately predict certain indicators using complex mathematical models that are not obvious even to experienced analysts.
Main types of data in GIS:
- Geographic coordinates and distances. Describe contours, areas and positions of plots, herd sizes, distance from certain objects, length of equipment movement routes, current location of machines, etc.
- Physical characteristics – soil and air humidity, atmosphere and planet surface temperature, degree of light reflection.
- Color gamut – the exact range of the light wave spectrum, which allows assessing the condition of plants, water in reservoirs, or soil for sowing.
- Productivity indicators – actual data on the use of seeds, agrochemicals and water, fuel consumption by equipment, working hours of employees, etc.
- Summary indices. Record key performance indicators of the enterprise, allowing to assess the condition of plots at a glance and make appropriate management decisions.
- Forecasts – calculated values that can be used in financial plans and enterprise development strategies.
By combining data from satellite observation systems, auxiliary equipment, and actual material consumption, you can get an excellent basis for automation or even robotization of the farm.
Areas of GIS Technology Application in Ukraine
The primary objective of GIS is to optimize production processes in agriculture. One of the first in Ukraine to achieve this result was the Kernel holding. The company created its own analytical GIS portal, connecting over 50 RTK sensors and 100 weather stations. It implemented variable-rate seeding and chemical application technologies. According to Kernel data, in regions with optimal conditions this increased yields by an average of 5%, and in unfavorable conditions by 12%. Separating areas with different degrees of weed infestation reduced herbicide costs by 50–70%.
Read also: RTK systems in the agricultural sector: what is a GNSS receiver and RTK signal
One of the top GIS technology providers in Ukrainian agriculture is Agro RTK System.NET. It provides access to satellite system data and handles installation and maintenance of ground equipment. According to its statistics, GIS application in small farms increases field operation efficiency by an average of 10–15%. Average optimization of labor and time costs reaches 10%, and material resources 20%. This makes small and medium-sized enterprises more competitive, particularly enabling them to enter international markets.
You can also adopt new technologies. A convenient and profitable solution for digitalization and automation of the farm is cooperation with the online service WEAGRO. It allows you to take agro-installment for equipment and services for agriculture. You can get a response within 30 minutes by choosing one of our partners or suggesting your supplier join the service.

GIS Mapping
GIS and cartography are closely related. Data obtained from satellite, aviation, and ground equipment is visualized and applied to terrain plans, which greatly simplifies their perception and use in work.
What is GIS Cartography
GIS mapping is the visualization of quantitative data about the condition of specific areas of the Earth’s surface. For this purpose, information is combined with physical terrain plans that reflect coordinates and topographic features. If you are wondering how GIS differs from a map or atlas, the best answer is interactivity. Geographic information systems allow you to select the necessary layers, visualization methods, and indicators, building a plan according to your needs.
How GIS Maps Work
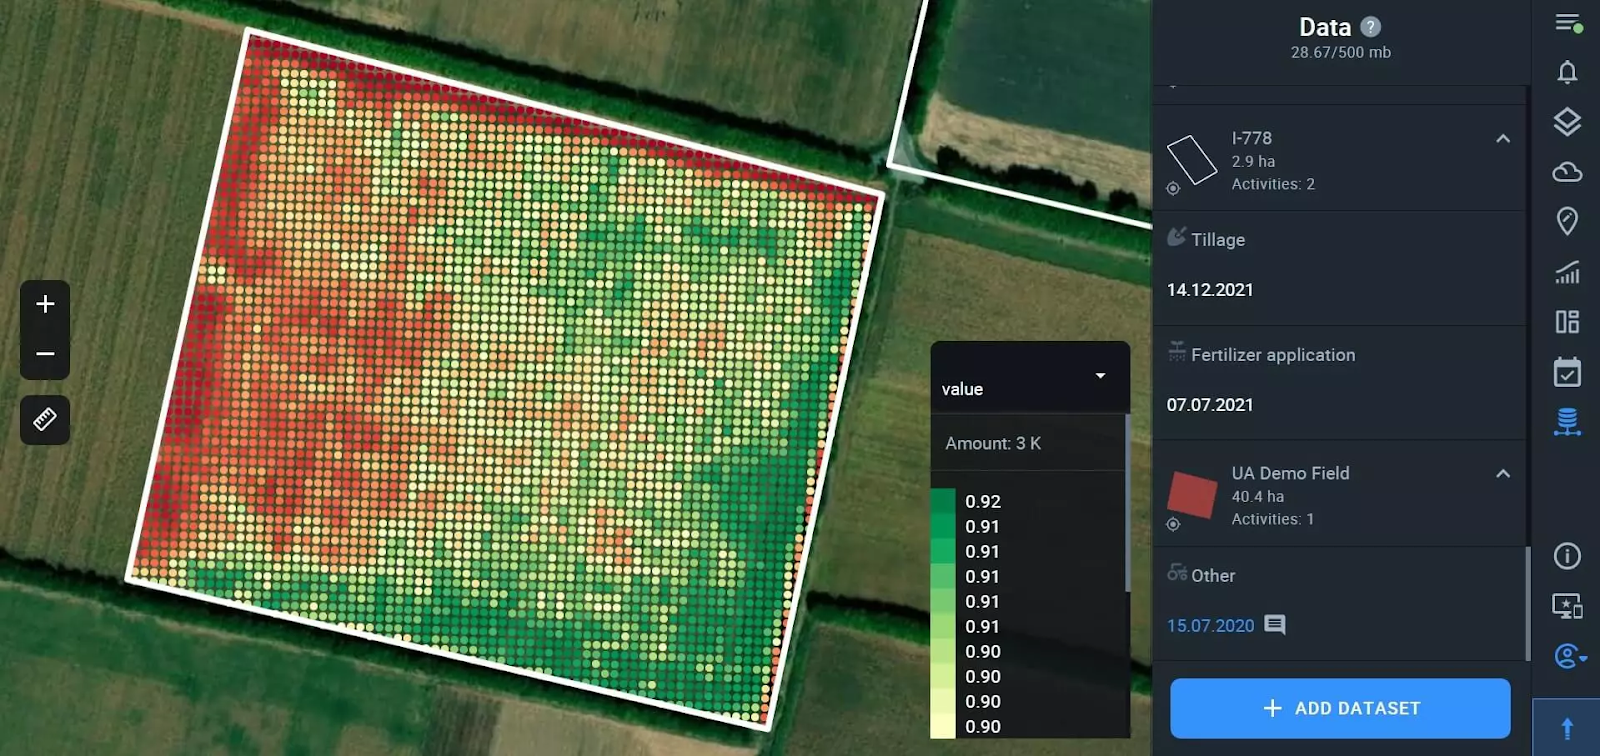
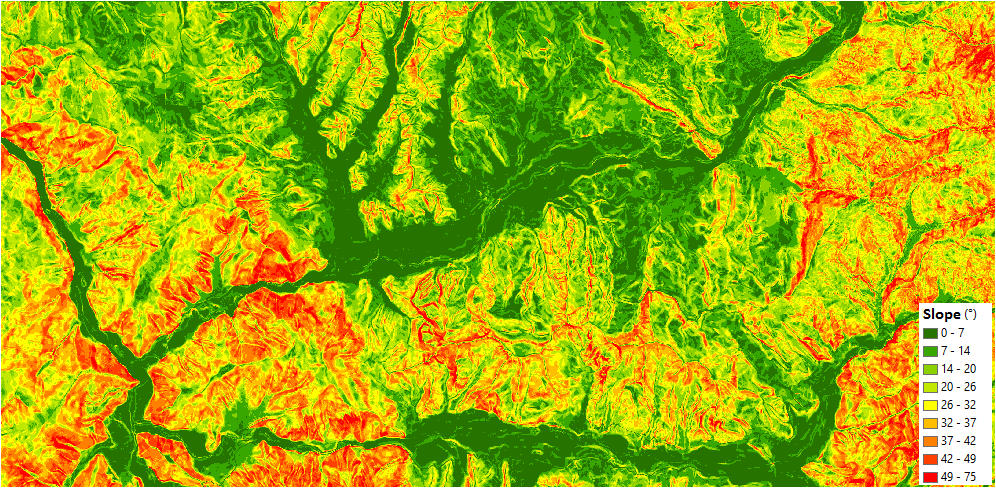
Statistics show that the human brain processes images 60,000 times faster than large arrays of text and numbers. Therefore, it is not surprising that GIS mapping relies on visualization. Typically, bright contrasting colors are used to highlight specific geographic zones. For example, this is what a fertilizer application map looks like: green indicates the maximum amount, red indicates the minimum.
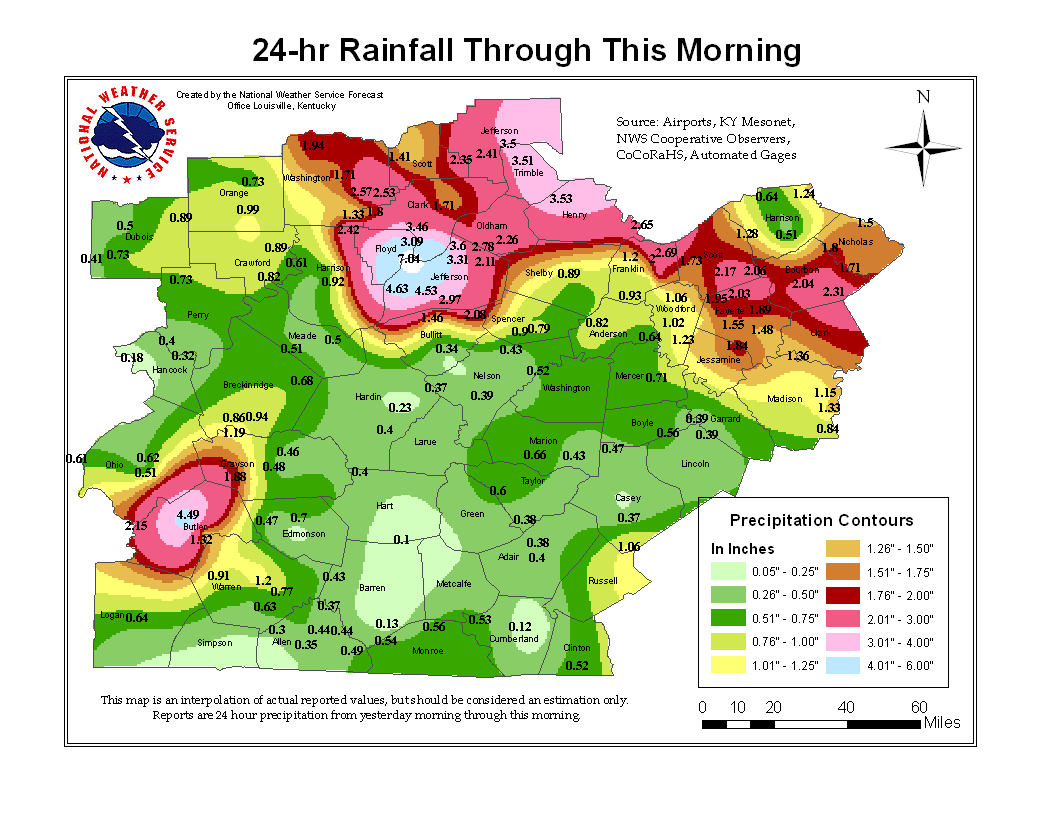
Still, in some cases, it’s impossible to do without digital markings and textual “legend”, i.e., data description. For example, this is what a natural precipitation distribution map looks like:
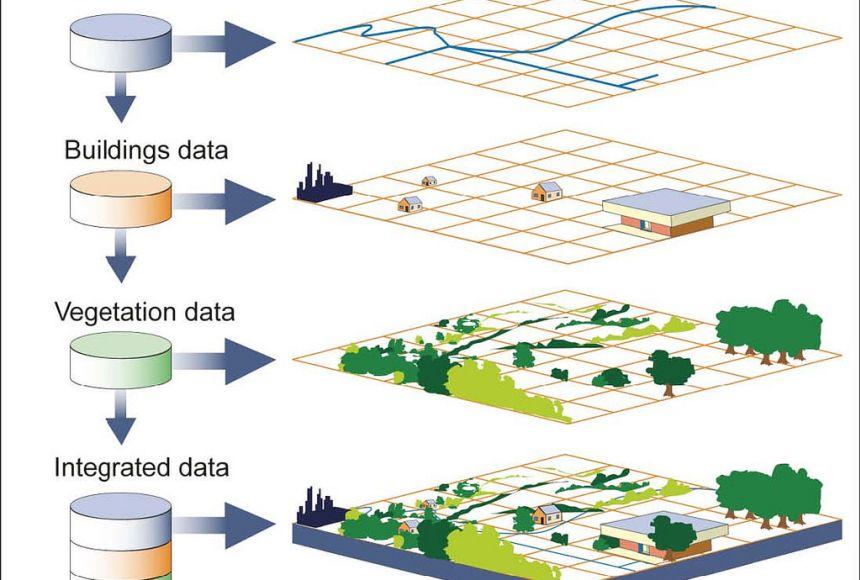
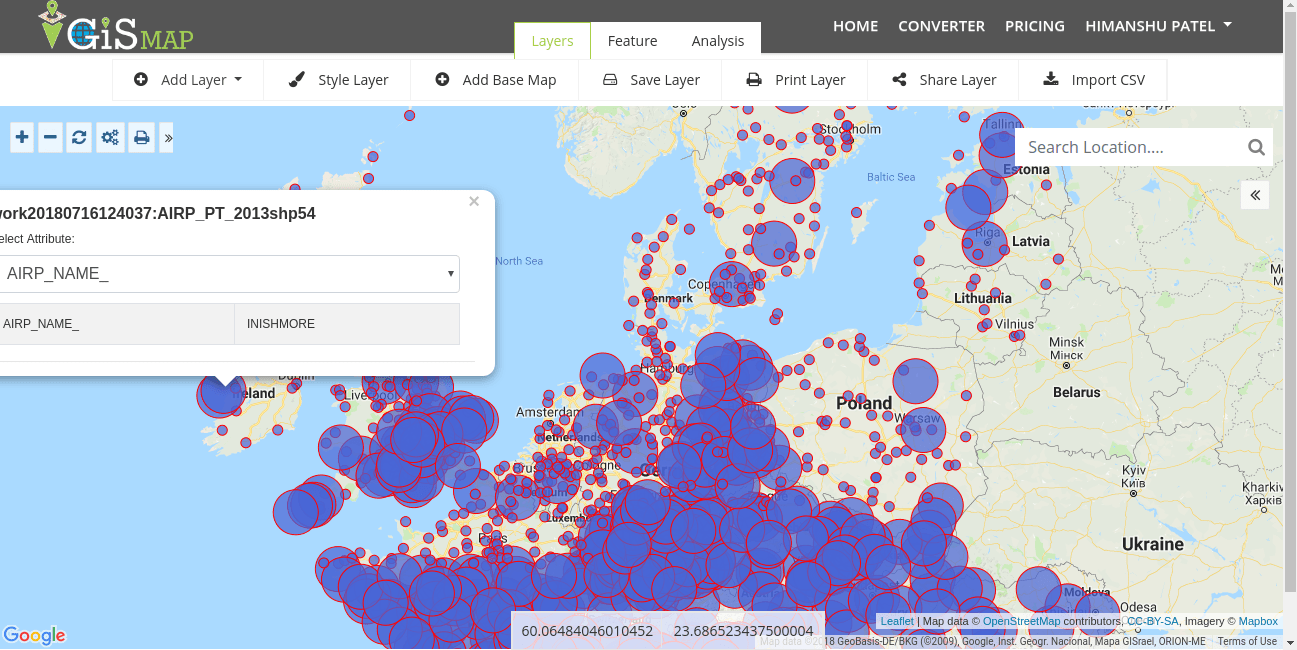
Usually, maps in popular GIS services are interactive multi-layer data complexes. You can turn on or off the display of certain information. The principle of operation of such systems is demonstrated in the image below:
Types of GIS Maps
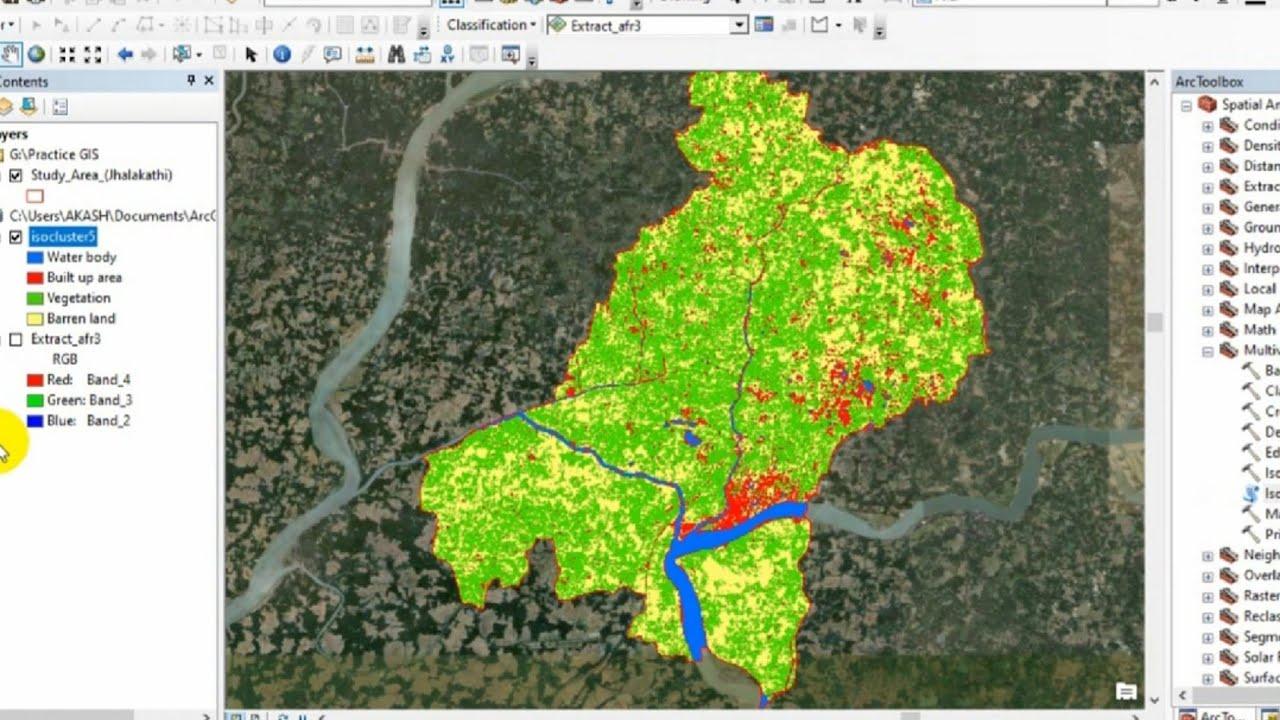
- Classification maps. On such maps, each color represents its own category. For example, you can mark corn crops in red, wheat in green, and rye in blue. As a result, your farm’s territory will consist of colored “patches” showing the crop structure.
- Heat maps. They show the distribution of a specific characteristic from minimum to maximum values. For example, GIS and mapping can display soil moisture or temperature levels in an area.
- Quantitative. If the data has very high density, it is more rational to display it as different colors or shades of one color. Next to such a map will be a legend explaining the meaning of these tones. For example, this can demonstrate the profitability or rental cost of land plots on a national scale.
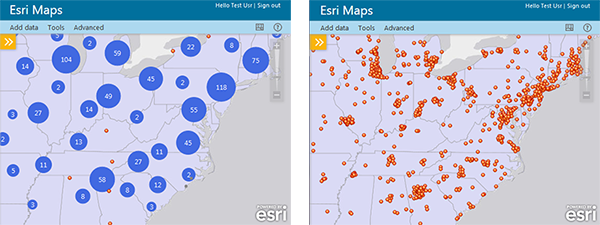
- Bubble. They display the values of certain parameters as bubbles of different sizes. The larger the bubble, the higher the indicator. For example, this can show grain yields by territorial community or district of a region.
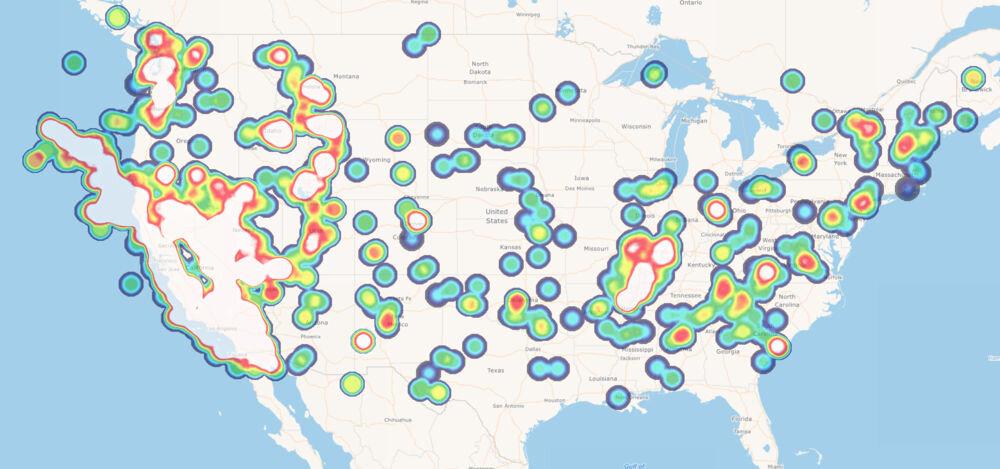
- Cluster. They show the location of specific objects on the map. If objects are located too densely in a certain place, they are combined into a cluster bubble indicating their quantity. For example, this can show the location of your agricultural machinery.
Advantages of GIS Maps
GIS maps are a very important tool for improving agricultural efficiency. By combining satellite observation data and enterprise performance indicators in them, you can draw conclusions about the consequences of your decisions. In addition, they are suitable for planning and analysis – interactive maps simplify the work of management and administrative staff.
Prospects for the Development of GIS Technologies in Ukraine
According to AgriLab CEO Yaroslav Boyko, GIS technologies provide a complex effect that can increase the profitability of one hectare of land by 17-45% depending on the starting conditions. He believes that Ukrainian farmers will soon face a simple choice – digitalize or work at a loss. Agriculture in Ukraine is moving towards European and international indicators – both in terms of yield and land rental value.
Read also: Precision Farming in Ukraine: Definition and Prospects
Therefore, it’s not about what prospects GIS technologies have and whether it’s worth implementing them. The question is when and how to start using them. Digital interactive maps and automation systems will soon become as common a farmer’s tool as a tractor or seeder.
Start modernization and digital transformation of your agricultural business today! The online service WEAGRO allows you to take agro-installment for GIS services and farm control equipment. We review applications within 30 minutes during business hours and provide a deferral of up to 180 days. By contacting us, you will receive a personalized offer that meets the needs and financial condition of your business.