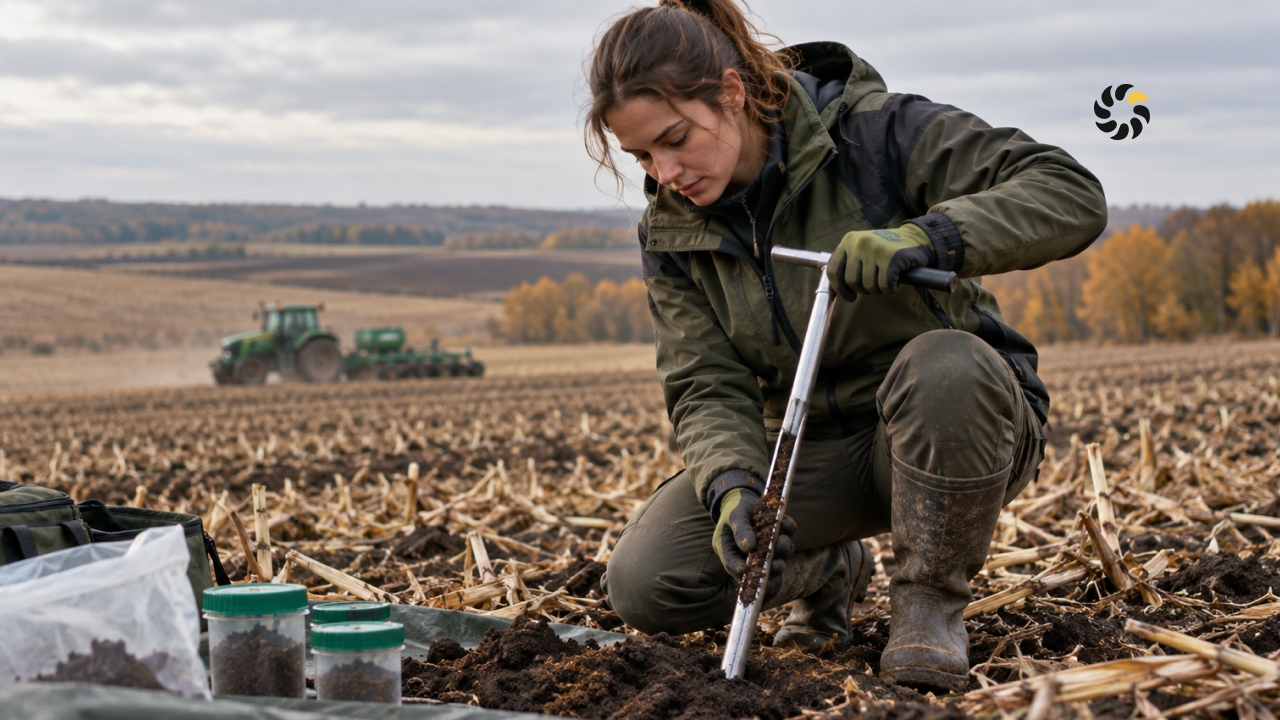
Soil analysis in autumn provides time to translate laboratory indicators into a nutrition program, a list of agricultural inputs, and a budget for spring work. In spring, the gap between field assessment, fertilizer purchasing, and machinery deployment is shortened. With early results, the agronomist can review the technology maps, and the finance department can plan the procurement schedule.
Indicators are selected for a specific decision. One field may require soil acidity testing, another phosphorus and potassium availability, and a problem zone electrical conductivity or profile analysis. The results then feed into the technology and budget.

Why is autumn soil analysis convenient for planning?
After harvest, the field is accessible for sampling, and the farm has time to agree on changes before the next season. An autumn survey makes it possible to:
- plan sampling without the spring time crunch;
- overlay the results onto yield maps and field history;
- clarify the need for specific nutrients;
- allocate fertilizer between fields and zones;
- plan liming or another remediation measure;
- prepare supplier requests and a payment calendar.
Along with the results, depth, weather, preceding crop, and applications are recorded. Mineral nitrogen changes under the influence of temperature, precipitation, mineralization, leaching, and plant uptake. The need for a spring update is agreed with the agronomist and the laboratory.
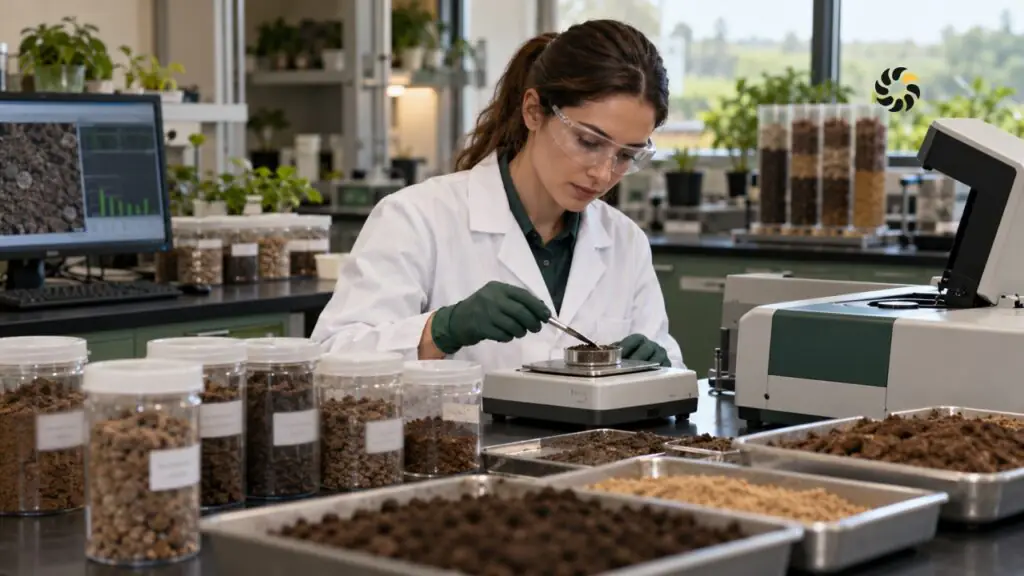
Which soil tests should be ordered in autumn?
The list is formed based on the crop, soil type, fertilization history, and field issue. Each indicator is linked to a specific decision.
| Test | What it shows | Which decision it supports |
| pH | Soil reaction | Assess the need for acidity correction and choose a remediation plan |
| Organic matter, humus | Soil condition and potential | Refine the long-term fertilization strategy |
| Phosphorus | Availability of accessible P forms by the chosen method | Adjust the feasibility and rate of phosphorus nutrition |
| Potassium | Availability of accessible K forms | Revise the rate and distribution of potassium fertilizers between fields |
| Mineral N | Available nitrogen at the time of sampling | Refine the nitrogen strategy |
| Sulfur | S availability under the applied methodology | Adjust the program for crops with corresponding needs |
| Magnesium and calcium | Nutrient availability and specific properties of the cation exchange complex | Assess nutrition and parameters of remediation measures |
| Electrical conductivity, EC | Concentration of soluble salts | Diagnose areas at risk of salinization |
Laboratory packages often cover pH, organic matter, phosphorus, and potassium. Nutrient soil analysis is assessed with the method taken into account. For phosphorus, different extractants have their own interpretation scales, so the number in the report does not by itself define a product rate.
Soil sampling: how to obtain a representative sample
If a composite sample distorts the actual condition of the field, laboratory accuracy cannot correct for a sampling error. Heterogeneous areas are divided by soil type, terrain, application history, yield, or consistent differences in crop development.
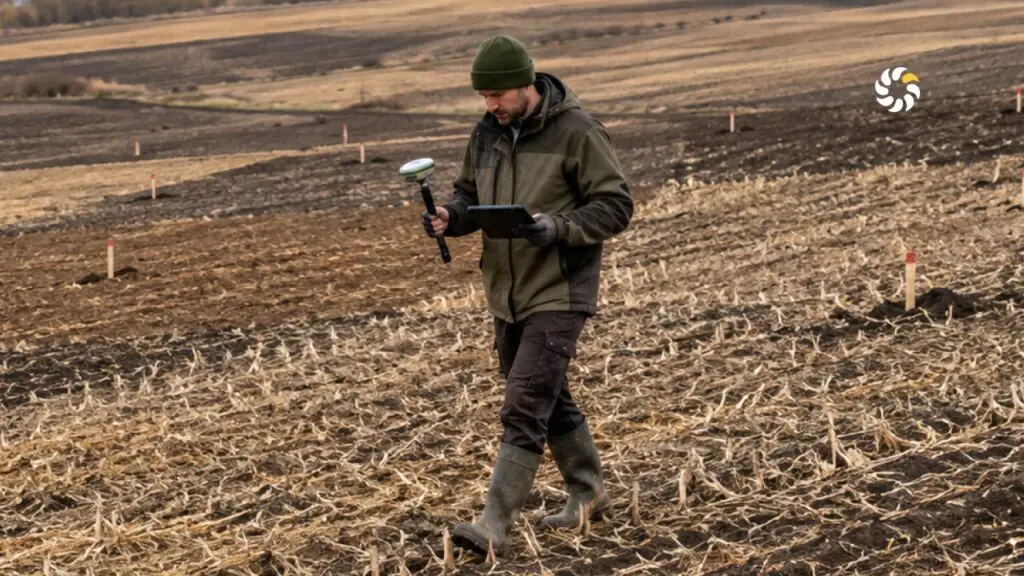
The plan is agreed with the laboratory: the number of point samples, mixing, depth, mass, labeling, geolocation, delivery, and storage. A composite sample is formed from multiple point samples taken from a representative zone. The number of sampling points is determined by the field and the type of analysis.
The field edge, a local puddle, an old fertilizer pile, or a turning strip are not included in the overall sample. A production-relevant zone is examined separately. The same route, depth, season, and method are kept consistent from year to year.
How do you read the results of an agrochemical survey?
The laboratory report is linked to the crop and the planned yield. The review is carried out step by step:
- Check the units of measurement and the determination method.
- Verify the sampling depth and date.
- Determine the availability class using the appropriate scale.
- Take into account the crop, variety or hybrid, and planned yield.
- Review the history of mineral and organic applications.
- Compare the indicators with yield maps and crop condition.
- Check whether pH, nutrients, and field signs are consistent with each other.
- Calculate several options for the plant nutrition program.
- Choose the option that best balances agronomic effect and budget.
Data from different laboratories or methods may use different scales. To track soil fertility over time, a consistent methodology should be maintained. If results conflict with the actual crop condition, check the sample, the profile, and other limiting factors.
How do the results help you purchase fertilizer more precisely?
After interpretation, the agronomist adjusts the technology map. The logic covers area, planned yield, field data, active ingredient rate, product, total volume, price, and budget. Fertilizer calculations are made by field or by confirmed zone.
Results can confirm the existing plan, change the rate, redistribute resources, or add a remediation measure. Sometimes the study increases planned costs due to an identified need. Such an adjustment targets the factor that was limiting yield or the effectiveness of other operations.
After the farm’s overall needs are summarized, warehouse stock is checked and the order volume is determined. The next question is when it is more cost-effective to purchase agricultural inputs, taking into account price, availability, logistics, and liquidity.

How much can you save: a sample calculation for 500 hectares
The farm planned to apply the same program across 500 hectares. The assumed product rate was 150 kg/ha, at a price of UAH 24,000/t. The initial volume was 75 t, with a budget of UAH 1,800,000.
After the zonal study, the agronomist kept 150 kg/ha on 250 ha, set 120 kg/ha for 150 ha, and set 180 kg/ha for 100 ha. The adjusted volume came to 73.5 t:
- 250 ha × 150 kg = 37.5 t;
- 150 ha × 120 kg = 18 t;
- 100 ha × 180 kg = 18 t.
The product cost after adjustment is UAH 1,764,000. If sampling, laboratory testing, and interpretation cost an estimated UAH 25,000, the calculated savings amount to UAH 11,000: 1,800,000 − 1,764,000 − 25,000. The sum is small relative to the overall budget, but the farm simultaneously increased the rate in the zone with confirmed need and reduced it where the previous program was excessive.
The result depends on zone area, prices, the cost of diagnostics, and the crop’s response. In a second scenario, the adjusted budget may increase. In that case, the analysis provides grounds to shift funds to an area with a potentially limiting factor. The impact of the decision on cost per hectare and margin can be assessed using the economics of crop production.
When is a basic study not enough?
Extended diagnostics are needed in cases of consistently low yield in a particular zone, patchy crop stands, sharp heterogeneity, suspected compaction, or issues with acidity, salinity, or water regime. A separate check is needed when laboratory figures do not explain the actual condition of the crop.
Depending on the question, plant tissue, soil profile and density, particle-size distribution, or irrigation water may be examined. The problem and its possible causes are formulated first, and the method is chosen afterward. This approach keeps diagnostic costs in line with the task and provides data that can be translated into a technological decision.
How do you factor the results into the 2027 season budget?
After interpretation, the farm adjusts its technology maps, consolidates fertilizer needs, subtracts usable stock, and requests supplier quotes. A procurement plan is then developed:
- Determine the volume of each product by field and application timing.
- Calculate the base and reserve procurement cost.
- Spread orders and payments across months.
- Overlay the calendar onto the cash flow forecast.
- Identify periods of working capital shortage.
- Review supplier terms and available financing sources.
Practical approaches to budgeting are covered in the article on how to plan agricultural input spending. If it makes sense to lock in part of your resources earlier, the plan can be complemented by the article on purchasing seed, crop protection products, and fertilizer.
The determined volumes and timelines show the monthly strain on liquidity. In case of a potential shortfall, you can review WEAGRO financial solutions for agribusiness and supplier terms.
Checklist before ordering tests
Before ordering laboratory tests, it is necessary to determine which specific management decisions the farm plans to make based on the data obtained. This determines the list of indicators, the sampling scheme and depth, the number of sampling points, the need for geolocation, and the level of detail in the study. Proper preparation helps obtain results that can be used in planning the crop nutrition program, purchasing resources, and building the budget for the next season. Answer the following questions:
- What decision needs to be made based on the result?
- Which fields and zones will be studied?
- When was the previous agrochemical soil analysis conducted, and by which method?
- What sampling depth and scheme are needed?
- How will the composite sample be formed and labeled?
- Is geolocation of sampling points needed?
- Which crops and yields are planned for 2027?
- What is the field’s fertilization history and problem history?
- Who will interpret the laboratory report?
- How will the data feed into the technology map and budget?
After receiving the laboratory report, the results need to be translated into specific decisions for each field or individual zone. In a working table organized by field, the conclusion, planned action, required resource, estimated cost, and procurement timeline are recorded. For example, data on phosphorus and potassium availability, acidity, or other tested indicators can be factored into application rate calculations and spending prioritization.
This approach makes it possible to link the test results to the farm’s technology map and 2027 budget. Agronomic decisions gain quantitative justification, and the financial plan can be detailed by field, crop, type of resource, and procurement timing. It also helps estimate fertilizer and other input needs in advance and spread spending across the season.
Autumn diagnostics creates a time buffer for reviewing technology and budget ahead of spring work. The practical value comes from the full chain: a representative sample, a suitable method, correct interpretation, an updated technology map, refined resource needs, and a procurement calendar.
The financial outcome depends on the field. The study may reduce unjustified application, reveal a need for additional nutrition, or shift part of the budget between zones. In every case, the farm ends up with a more well-grounded spending plan for the 2027 season.